01 · Category input
One category enters.
A market, a brand, or a question — before it means anything, it is just a label.
Input
Beauty buyers
Known worlds
0
The cultural data layer
Culturas connects videos, posts, images, comments and conversations into the CultureGraph™ — a structured data layer that reveals the audience behavior shaping any category or topic.
Our method is digital anthropology: reading how people make meaning together, not just what they click.
What Culturas is
Culturas is a cultural intelligence company. It reads the public social internet — video, posts, images, comments and conversation — and structures it into the CultureGraph: a cultural data layer that shows how communities form, what earns their trust, and where behaviour is moving next.
Every term above is defined once, in the Culturas lexicon.


Trusted by
Everyone downstream works from the same raw material: billions of small public acts, published and then abandoned.
The internet is loud. Culture is where it means something.
A person sits inside a community, inside a scene, inside a culture. Flatten those shells and you get a segment. Keep them and you get resolution you can act on.
Targeting optimises delivery inside an assumption it never questions. Understanding changes what you make.
Inside the CultureGraph
The CultureGraph structures human meaning into a proprietary cultural map, revealing how people gather, what earns trust and where behavior is moving next.
It is not a dashboard you visit. It is a layer you build strategy, product, media and models on top of.
CultureAI platform
Built on the CultureGraph, CultureAI™ reveals emerging demand, distinct audience cultures and the forces shaping market behavior — helping teams decide what to create, launch, fund or scale.
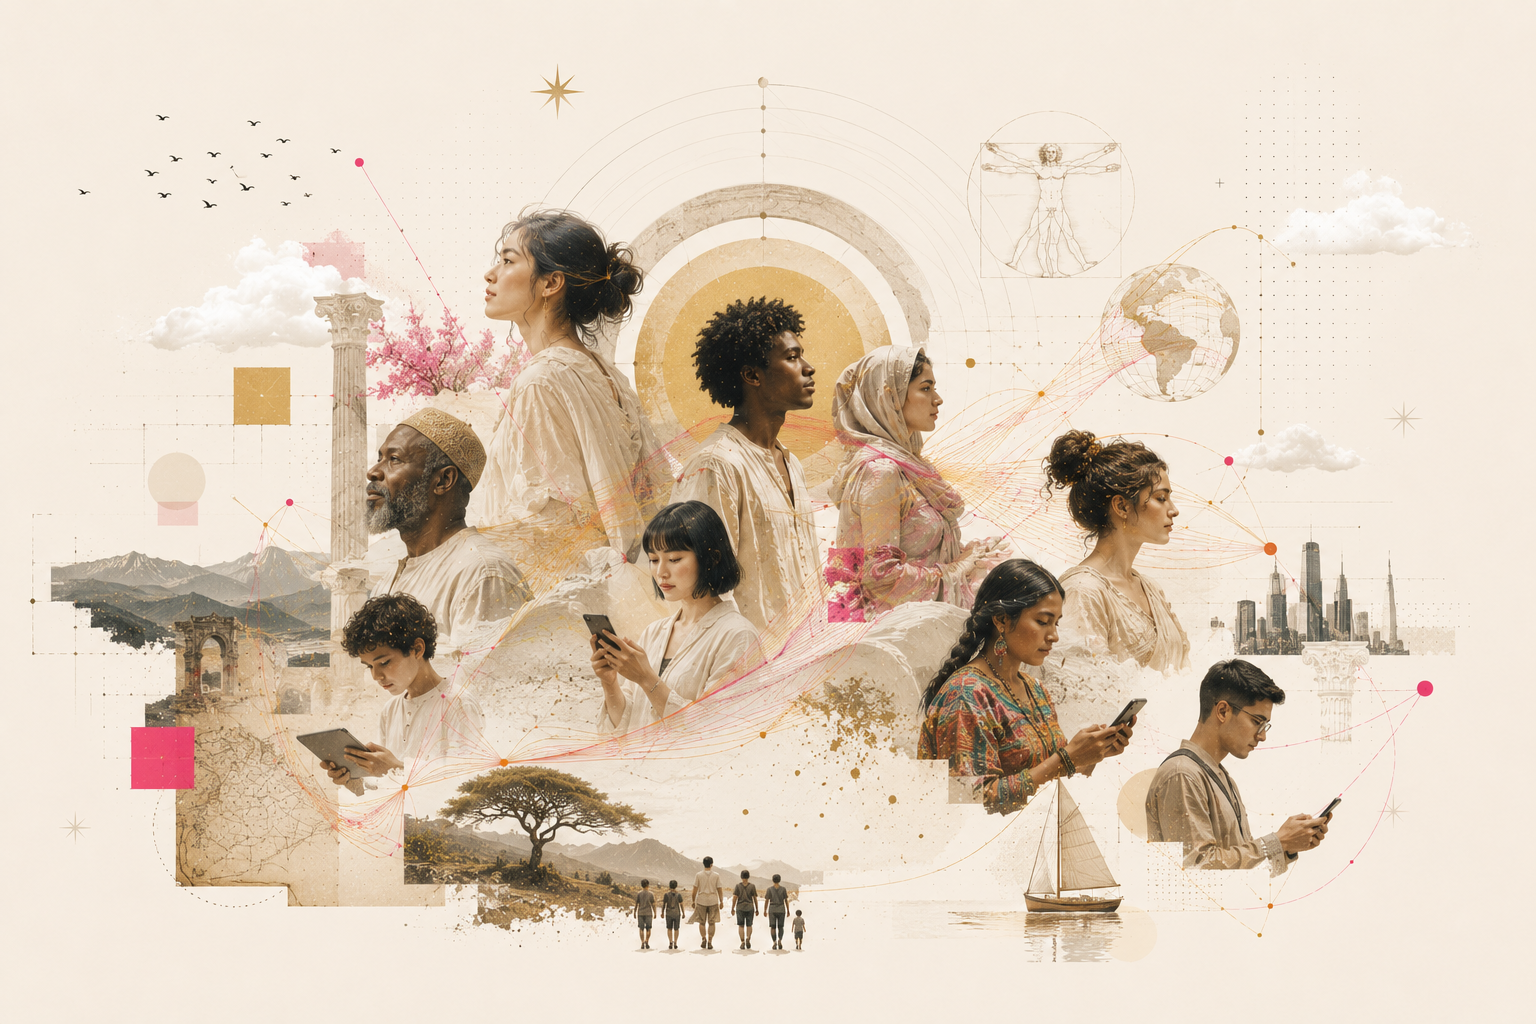
One species, many worlds
Every signal we map begins as a person.
Signal to action
Signal appears, a community adopts, language settles, behaviour normalises, the market follows. Most measurement arrives at the far right and calls it discovery.
We work from the left.
Ask the Co-pilot
Natural language in, evidence out: every answer traced back to the signals, communities and axes it came from.
The compounding advantage
The graph is cumulative. Each project adds axes, communities and history, so the asset you are building is understanding rather than deliverables.
How to work together
Choose the way you want to enter the graph.
The cultural data layer
Begin with one category, audience or strategic decision. Culturas will map the content, communities and Culturegraphics™ influencing what happens next.
The Culturas network